Golang finding memory leaks
29 October 2018
We are going to look at finding memory leaks in golang using a tool called pprof.
As a quick refresher, a memory leak is when an application holds onto memory after it is no longer needed. This comes up as problem because eventually the application runs out of available memory and crashes. The bright side is that it is sometimes easy to identify from looking at a memory usage graph that forms a “sawtooth” (an upward trending that falls of a clif:

Golang has a powerful tool called pprof that can make finding these leaks much easier. We’re going to use an example webserver that we suspect has a leak in it
TLDR:
If your app is currently crashing and you need to know what to do
- add
import _ "net/http/pprof" go tool pprof 0.0.0.0:$PORT/debug/pprof/$PROFILER_TYPEto generate profiler outputgo tool pprof $OUTPUTto analyzego tool pprof -base $OUTPUT_OLD 0.0.0.0:$PORT/debug/pprof/$PROFILER_TYPE
to generate profiler output of diff against a base
Walking through a sample app:
We are going to go though a sample app called ‘goleaky’ that we suspect may be leaking memory somewhere. The source code for goleaky is below, but we are going to use pprof to find out where
// main.go
package main

import (
	"log"
	"net/http"

	"goleaky/builder"
	"goleaky/validator"
)

func main() {
	go doWork()
	log.Println(http.ListenAndServe("localhost:6060", nil))
}

func doWork() {
	for {
		report := builder.BuildReport()
		validator.ValidateAndSave(report)
	}
}

// validator/validator.go
package validator

import "goleaky/repo"

func ValidateAndSave(report string) {
	if validate(report) == true {
		repo.SaveReport(report)
	}
}

func validate(report string) bool {
	return true
}

// builder/builder.go
package builder

func BuildReport() string {
	return "fancyReport"
}

// repo/repo.go
package repo

var savedReports = []string{}

func SaveReport(report string) {
	savedReports = append(savedReports, report)

	time.Sleep(10 * time.Microsecond)
	if len(savedReports) > 1000000 {
		panic("OOM")
	}
}
Since we are running a webserver, all we need to do is
add _ "net/http/pprof" to our imports in main.go, this automatically adds handlers under /debug/pprof/. From there we can use the CLI
tool go tool pprof $URL to start generating profiles of our app. I prefer visualals,
so we are going to tell pprof to output png of our memory usage with the
command go tool pprof -png http://localhost:6060/debug/pprof/heap, and we
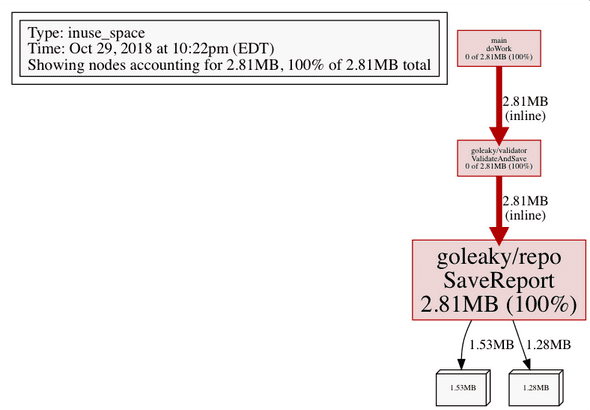
get an output name of a .png and a .pb.gz file, here is what our png looks like:

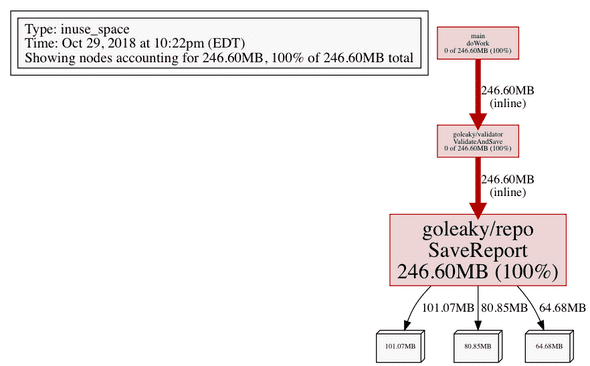
Since this is our first profile, we can use it as a baseline, running the profile command a few seconds later:

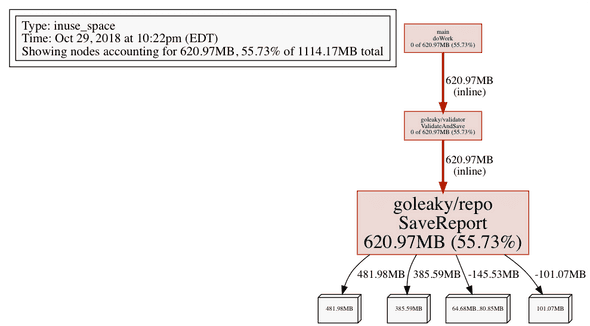
We can see some numbers got bigger. If we are still not sure where the leak is, we can us a previous snaphot as a base to show the diff (using a .pb.gz file that we had just created):
go tool pprof -base /pprof.alloc_objects.alloc_space.inuse_objects.inuse_space.047.pb.gz -png http://localhost:6060/debug/pprof/heap

What is really usefull here is that not only can we can see the total memory
used by our application, but also
a breakdown of the amount of memory used by each package, visually making the
higher usages larger and redder. For our app goleaky, we see main.go is using
lots of memory, but consuming none of it itself. Follow the tree down we can
see the culprit SaveReport function in our repo package is the one using all
our memory!
There are CLI ways to use pprof that do not involve images, with one of those .pb.gz we
generated we can do: go tool pprof /pprof.alloc_objects.alloc_space.inuse_objects.inuse_space.047,
taking us into a command line. Typing top split out a list of packages ordered
by memory usage:
  197.27MB   100%   100%   197.27MB   100%  goleaky/repo.SaveReport (inline)
         0     0%   100%   197.27MB   100%  goleaky/validator.ValidateAndSave (inline)
         0     0%   100%   197.27MB   100%  main.doWork
These commands were enough to get me started, if you want to find out more (like
profiling cpu instead of memory), the docs are here:
https://golang.org/pkg/runtime/pprof/
As well as a few resources I found useful:
https://jvns.ca/blog/2017/09/24/profiling-go-with-pprof/
https://medium.com/@felipedutratine/profile-your-benchmark-with-pprof-fb7070ee1a94
https://blog.golang.org/profiling-go-programs